Study Materials for IBPS, Bank Exams : Data Interpretation : Mix Graphs
![]()
Study Materials for IBPS, Bank Exams : Data Interpretation : Mix Graphs
You can compare several categories by a graph of the cumulative type. These are usually bar or line graphs where the height of the bar or line is divided up proportionately among different quantities.
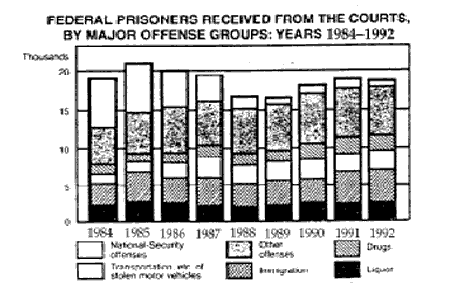
Q. In 1986, roughly what percent of the federal prisoners received from the courts were guilty in other offenses?
(a) 10
(b) 15
(c) 25
(d) 30
The total number of prisoners in 1986 was about 20,000, and guilty in other offences was about 5,000.
Since the correct answer is (c).
In DI section of the question paper, the intention should be to attempt all questions as skipping them would amount to losing precious scoring opportunities. There are two approaches to arrive at the solution. One is to work on the data to arrive at the correct answer. The other one is the Elimination method which requires working backwards by eliminating the wrong choices. Though the elimation method is more time consuming, it may still be preferred where direct solution involves enormous calculation of data.
At times, examiners pose rather difficult data sets at the beginning of the sections. These are intended to be ‘SPEED BRAKERS’ which take away much of precious time. Therefore, as a rule, scan the whole section quickly before actually attempting the questions and start with easier part of the section.
In some exams, data are presented in more than one table or graph. The objective is to test not only quantitative skills but also relational and analytical ability. Recently, in some exams the questions in this section are being framed in caselet (paragraph) form, beginning with probability and reasoning questions. It is left to the reader to study the case, call out requisite data and arrange it in a suitable form for meaningful interpretation. It is best to arrange data with rough sketch to hasten comprehension.
Important Tips: These will help in saving time, reducing mistakes and finding solution easily.
-
Get a general picture of the information by looking at the entire table or graph.
-
Read the table title, nomenclatures of columns and rows.
-
Simplify the questions being asked. Break down lengthy questions into smaller parts.
-
Use only the information given for finding solutions. Select the appropriate data for answering a question.
-
Eliminate impossible choices.
-
Avoid lengthy calculations.
-
Try to interpret through trends of the data in the graph. Whenever possible, try to answer the questions by visualizing rather than by computing.
-
Where calculation is required prefer approximate values at the first stage. Go for exact calculation where values are close and require exact answer.
-
Be careful to use proper units.
-
Make correct use of your knowledge of basic mathematical rules, principles and formulae.
-
Don’t confuse in decimals and percent ages. For example, 0.5% = 0.005.
-
Use pencil or straight edge of the answer sheet to read the graph and find approximate values.
-
Focus your answer on the question actually asked and not on what the question should be in your opinion.
-
Never do anything that is unnecessary.
-
Last, but not the least, make sure that the answer is sensible and reasonable.