(SBI PO Sample Material) Data Interpretation : Pie Chart (MCQs)
(SBI PO Sample Material) Data Interpretation : Pie Chart (MCQs)
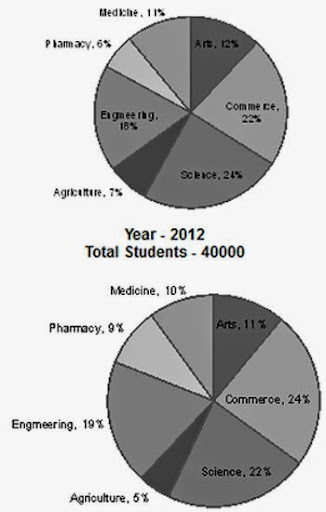
Directions : Study the following pie-diagrams carefully to answer these questions:
Number of students studying in different faculties in the years 2011 and 2012 from
State X
Year-2011
Total Students - 35000
1. In which faculty there was decrease in the number of students from 2011 to 2012?
(1) None (2) Arts
(3) Agriculture (4) Pharmacy
(5) Data Inadequate
2. What is the ratio between the number of students studying pharmacy in the years 2011 and 2012 respectively?
(1) 4 : 3 (2) 3 : 2
(3) 2 : 3 (4) 7 : 12
(5) Data Inadequate
3. What was the approximate percentage increase in the number of students of Engineering from the year 2011 to 2012?
(1) 17 (2) 15
(3) 25 (4) 20
(5) Data Inadequate
4. In the year 2011, the number of students studying Arts and Commerce together is what percent of the number of students studying these subjects together in 2012?
(1) 76 (2) 85
(3) 82 (4) 79
(5) Data Inadequate
5. In which of the following faculties the percent increase in the number of students was minimum from 2011 to 2012?
(l) Arts (2) Science
(3) Commerce (4) Medicine
(5) Data Inadequate