(Study Materials) Data Interpretation : Introduction of Data Interpretation - MCQ
(Study Materials) Data Interpretation : Introduction of Data Interpretation - MCQ
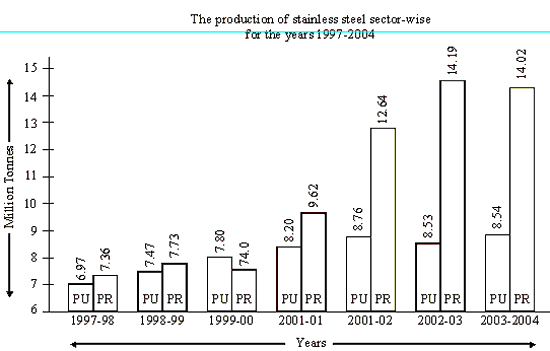
Q. No. (1-5) The graph shows the production of stainless steel, sector-wise, for the years 1997-2004. The production of stainless steel sector-wise, for the years 1997-2004:
.
1. The production in the private sector for 2002-03 is what per cent of the total production of 2002-03?
1. 37.54
2. 62.46
3. 24.91
4. 52.46
5. None of these
2. During which year was the percentage increase in
total production highest as compared to the previous year?
1. 2000-01
2. 2002-03
3. 2001-02
4. 1998-99
5. None of these
3. During which year was
the percentage increase in total production lowest as compared to
the previous year?
1. 1998-99
2. 2000-01
3. 2002.03
4. 1999-2000
5. None of these
4. The percentage
increase in production for the private sector from 1997-98 to
2002-03 is.
1. 48.13
2. 92.80
3. 31.69
4. 86.73
5. None of these
5. What is the
percentage share of the public sector in the total production for
the year 2003-04?
1. 37.85
2. 62.46
3. 24.91
4. 32.54
5. None of these
© BANKEXAMPORTAL.COM