Study Materials for IBPS, Bank Exams : Data Interpretation : Line Graphs
![]()
Study Materials for IBPS, Bank Exams : Data Interpretation : Line Graphs
Line graphs are used to show how a quantity changes continuously. Very often the quantity is measured as time changes. If the line goes up, the quantity is increasing; if the line goes down, the quantity is decreasing; if the line is horizontal, the quantity is not changing. To measure the height of a point on the graph, use your note board as a straight edge.

Q. The ratio of productivity in 2007 to productivity in 1980 was about
(a) 1 : 4
(b) 1 : 3
(c) 3 : 1
(d) 4 : 1
In 2007 productivity had an index number of 400, and the index numbers are based on 1980 = 100. So the ratio is 400 : 100 = 4 : 1. Therefore, the answer is (d).
Example
Directions: The graph given here shows a car following the linear path with uniform speed. Study the graph and answer the questions.
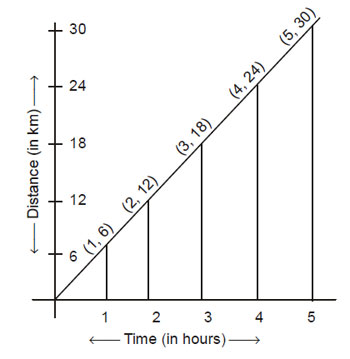
1. The speed of the car is
(a) 12 km/hr
(b) 6 km/hr
(c) 18 km/hr
(d) 24 km/hr
2. The speed of the car in metres per minute is
(a) 60
(b) 100
(c) 600
(d) 1000
3. The distance travelled by the car in 4.5 hours is
(a) 27 km
(b) 30 km
(c) 36 km
(d) 40 km
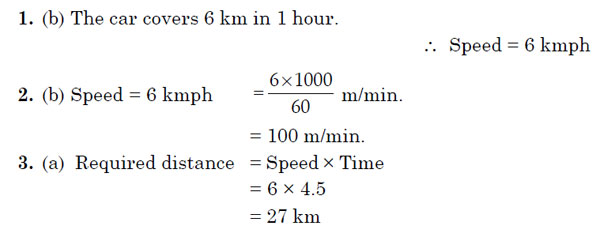
Solution: